|
|
LONG-RUN INDUSTRY SUPPLY CURVE: The relation between market price and the quantity supplied by all firms in a perfectly competitive industry after the industry as completed its long-run adjustment. The long-run industry supply curve effectively traces out a series of equilibrium prices and quantities the reflect long-run adjustments of a perfectly competitive industry to demand shocks. This long-run adjustment can take one of three paths: increasing, decreasing, and constant. These three adjustment paths indicate an increasing-cost industry, decreasing-cost industry, and constant-cost industry, respectively.
Visit the GLOSS*arama
|
|


|

|
                           MARGINAL REVENUE CURVE, MONOPOLY: A curve that graphically represents the relation between the marginal revenue received by a monopoly for selling its output and the quantity of output sold. Because a monopoly is a price maker and faces a negatively-sloped demand curve, its marginal revenue curve is also negatively sloped and lies below its average revenue (and demand) curve. A monopoly maximizes profit by producing the quantity of output found at the intersection of the marginal revenue curve and marginal cost curve. Monopoly is a market structure with a single firm selling a unique good. As the only firm on the supply-side of the market, monopoly is a price maker and has extensive market control, facing a negatively-sloped demand curve. If a monopoly wants to sell a larger quantity, then it must lower the price.The marginal revenue curve reflects the degree of market control held by a firm. For a perfectly competitive firm, the marginal revenue curve is a horizontal, or perfectly elastic, line. For a monopoly, oligopoly, or monopolistically competitive firm, the marginal revenue curve is negatively sloped and lies below the average revenue (demand) curve. Marginal Revenue Curve,
Medicine Style |  |
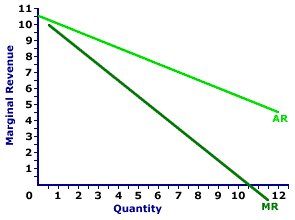
The marginal revenue curve (MR) for Feet-First Pharmaceutical, a hypothetical firm, is displayed in the exhibit to the right. Key to this curve is that Feet-First Pharmaceutical is a monopoly provider of Amblathan-Plus and thus faces a negatively-sloped demand curve. Larger quantities of output are only possible with lower prices.The vertical axis measures marginal revenue and the horizontal axis measures the quantity of output (ounces of medicine). Although quantity on this particular graph stops at 12 ounces of medicine, it could go higher. This exhibit displays both the marginal revenue curve (MR) and the average revenue curve (AR), which is also the demand curve. Both are negatively sloped, but the marginal revenue curve lies below the average revenue curve, which means that marginal revenue is less than average revenue (and price) for any given quantity. How can this be? Why is this so? An explanation seems in order. Consider the situation facing the Feet-First Pharmaceutical monopoly. If Feet-First Pharmaceutical sets the Amblathan-Plus price at $8.50, then buyers are willing to purchase 4 ounces. However, if Feet-First Pharmaceutical wants to increase the quantity sold from 4 ounces to 5 ounces, then it MUST lower the price from $8.50 to $8 per ounce as it moves along the demand (average revenue) curve. But here is the catch: Feet-First Pharmaceutical must lower the price for ALL, not just for the fifth ounce. What happens to Feet-First Pharmaceutical's total revenue when it lowers the price? Two forces are at work: (1) the revenue gained by adding extra ounces and (2) the revenue lost by lowering the price for existing ounces. Marginal revenue is the net result of both. - First, by lowering its price, Feet-First Pharmaceutical increases the quantity sold from 4 ounces to 5 ounces. This extra ounce generates an extra $8 of revenue, the price of the sixth ounce. This is $8 of extra revenue that Feet-First Pharmaceutical did NOT have at the higher price. If this is all that happens, then Feet-First Pharmaceutical has a marginal revenue of $8 for the sixth ounce, equal to the price.
- Second, by lowering its price, Feet-First Pharmaceutical collects less revenue from its other 4 ounces. It would have collected $8.50 per ounce for a total of $34. But with the lower $8 price it collects only $32, a reduction of total revenue by $2, or $0.50 per ounce.
The $8 gained by selling the extra ounce is partially offset by the $2 lost from lowering the price for other ounces. On net, total revenue increases by only $6. The loss of revenue collected on existing ounces is the key reason that marginal revenue is less than price.Although this marginal revenue curve is based on the production activity of Feet-First Pharmaceutical, a well-known monopoly firm, it applies to any firm with market control. Monopolistic competition and oligopoly firms that also face negatively-sloped demand curves that generate comparable marginal revenue curves.

Recommended Citation:MARGINAL REVENUE CURVE, MONOPOLY, AmosWEB Encyclonomic WEB*pedia, http://www.AmosWEB.com, AmosWEB LLC, 2000-2025. [Accessed: July 12, 2025].
Check Out These Related Terms... | | | | | | | | | | |
Or For A Little Background... | | | | | | | | | | | |
And For Further Study... | | | | | | | |
Related Websites (Will Open in New Window)... | | | |
Search Again?
Back to the WEB*pedia
|


|

|
BROWN PRAGMATOX
[What's This?]
Today, you are likely to spend a great deal of time browsing through a long list of dot com websites hoping to buy either one of those "hang in there" kitty cat posters or a velvet painting of Elvis Presley. Be on the lookout for small children selling products door-to-door.
Your Complete Scope
This isn't me! What am I?
|

|
|
In the early 1900s around 300 automobile companies operated in the United States.
|

|
|
"What gets measured gets done." -- Peter Drucker, educator
|

|
IBB
International Bank Bonds
|

|
|
Tell us what you think about AmosWEB. Like what you see? Have suggestions for improvements? Let us know. Click the User Feedback link.
User Feedback
|


|


